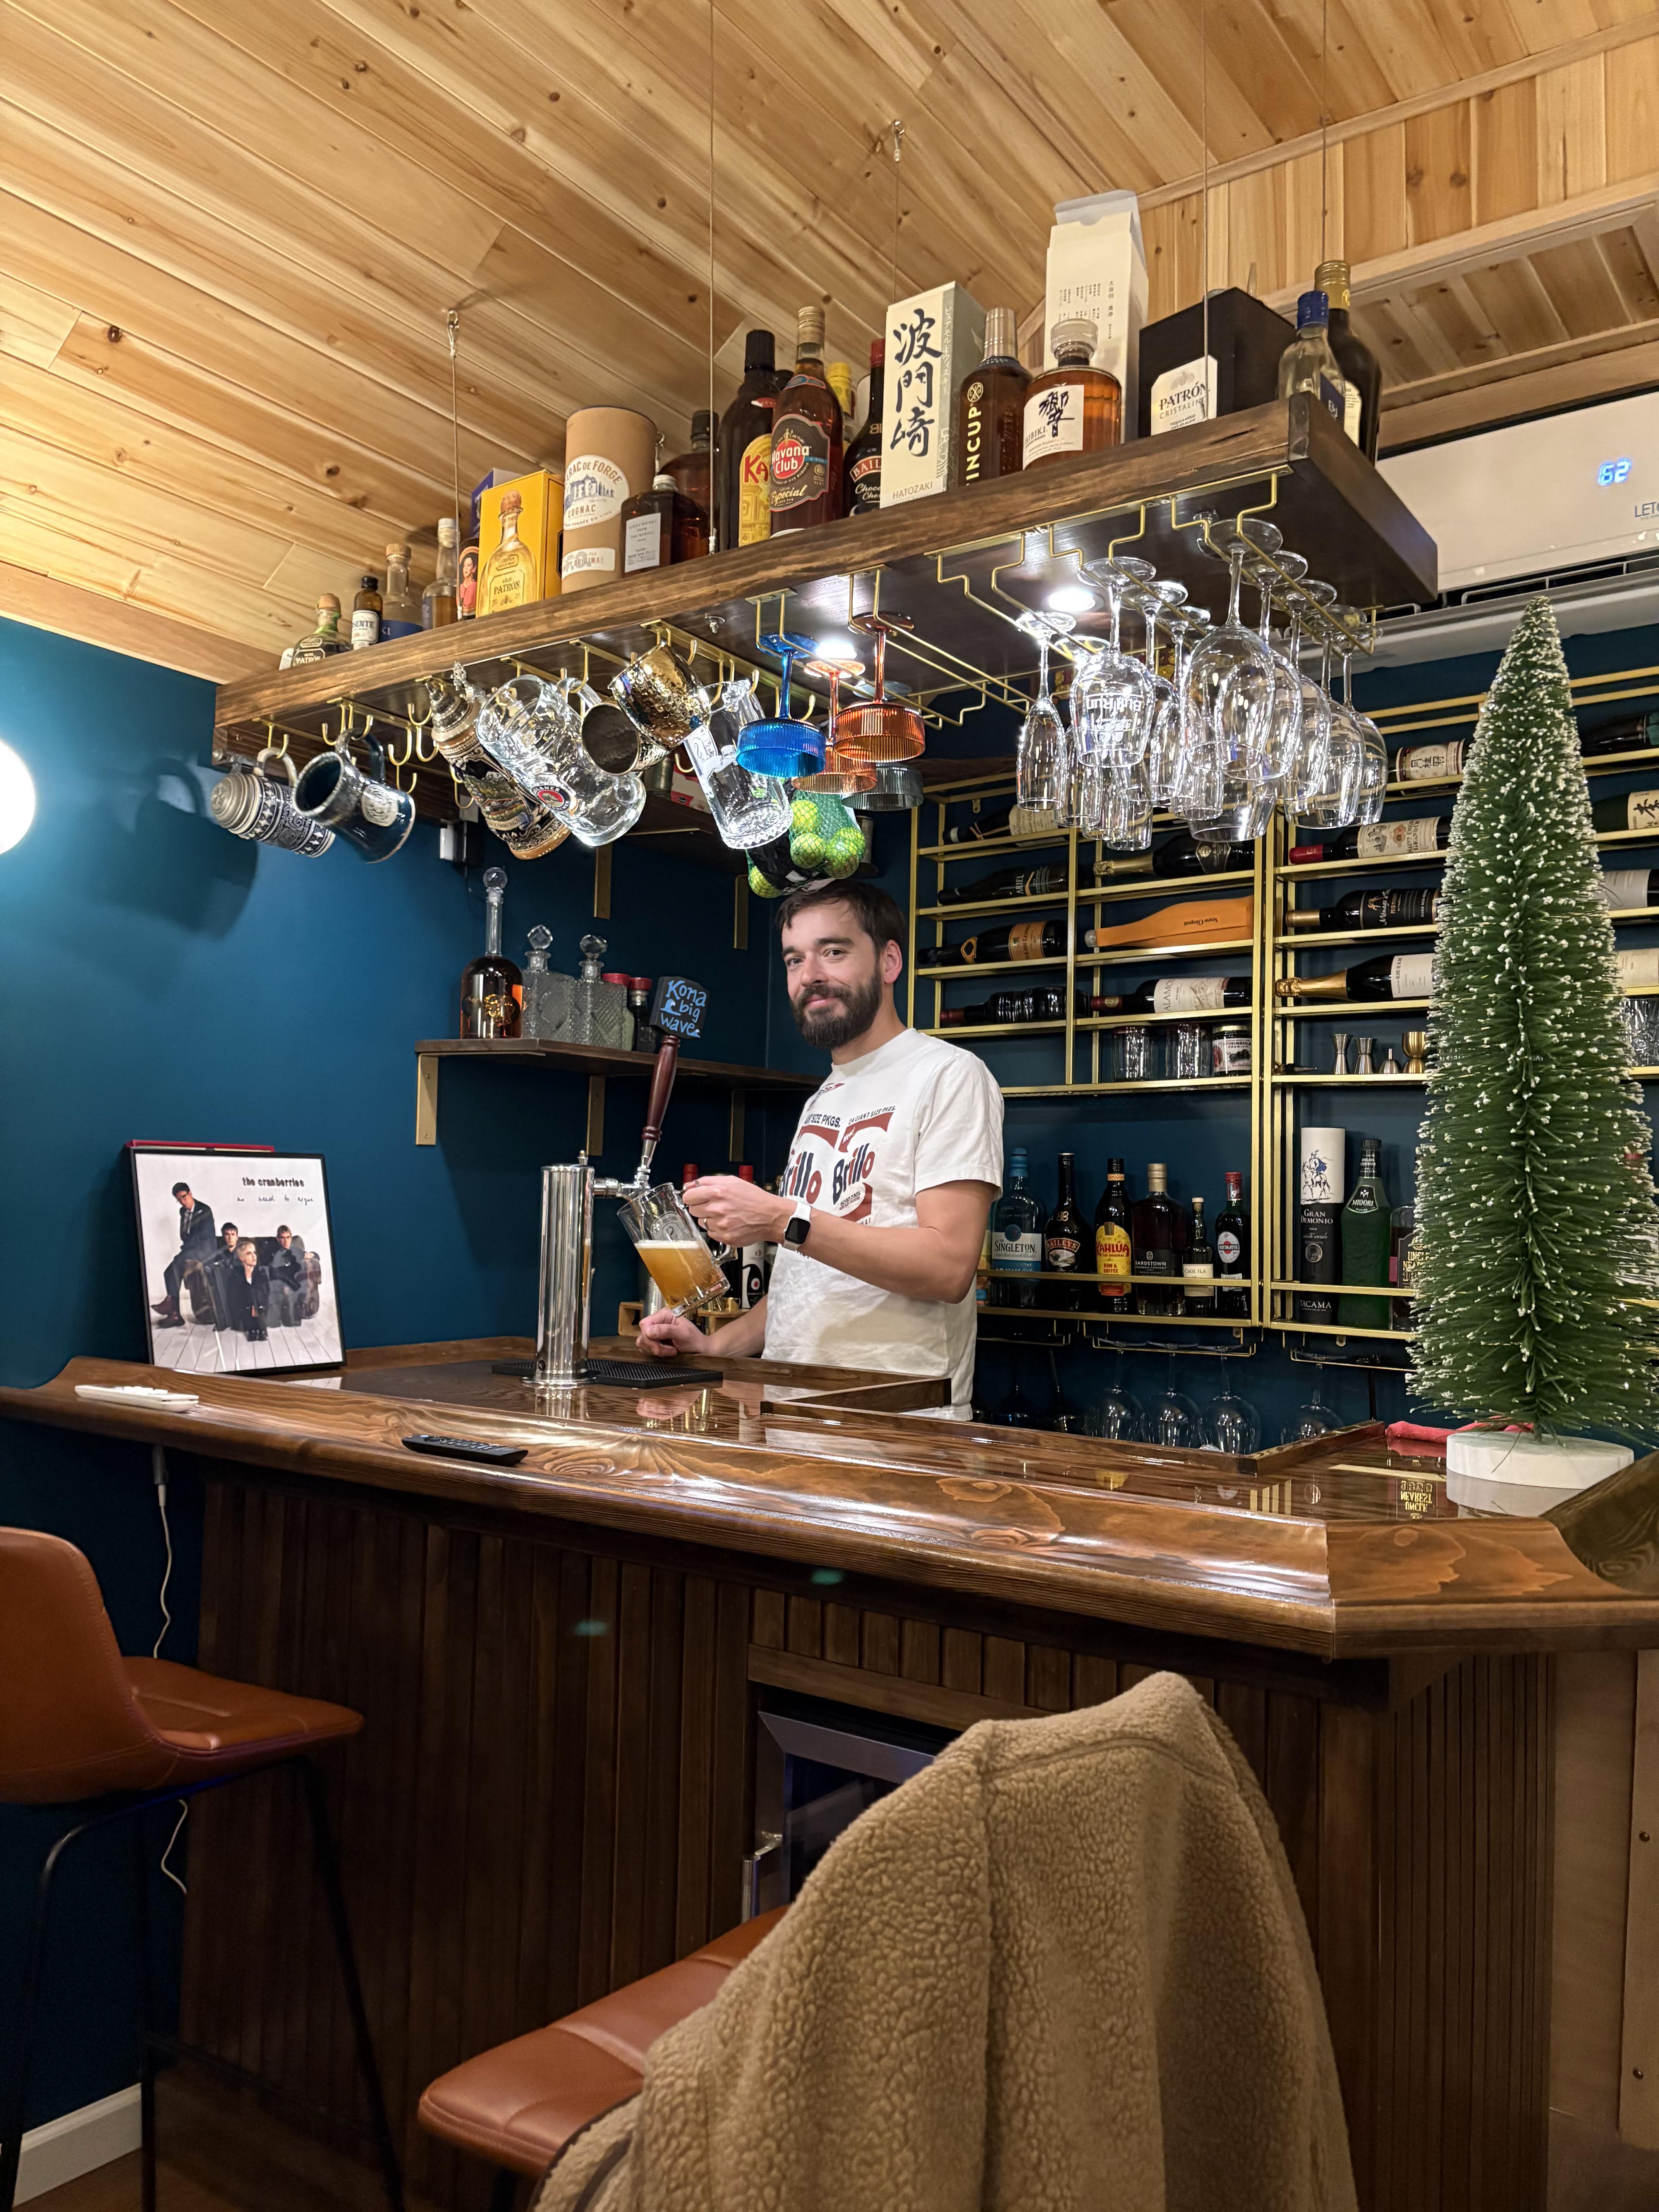
Eventually comes a day when a random forest won’t cut it. You need to classify images into categories, and the preprocessing alone is killing you. Neural networks to the rescue!
In this tutorial, we’ll start from the most basic of neural networks so you gain a foundation of what they are, how their layers works, and how they can be assembled with multiple inputs and outputs. We’ll build our networks and train them to classify some prepared data.
I’ve covered unsupervised learning for clustering and anomaly detection, but it has a lot of possible applications! In this notebook, we explore how it can be used for image compression with pixels. Furthermore, we will use unsupervised and semi-supervised learning to efficiently help our image classification algorithm. Check out the notebook here:
Sometimes you need to jump back pretty far in a git repo, but this gets tough because the default behavior of git log doesn’t give you all that much info. Here are some helpful takes, and you don’t need to memorize them! Just add them to your gitconfig (described below):
Detecting outlier datapoints is referred to as Anomaly Detection
How does Spotify make such great playlists on the fly just based on a single song? How do credit card companies detect fraud from hundreds of thousands of accounts without using training data? Unsupervised learning! Unlike supervised learning where we train out algorithm to label data based on previous training sets, unsupervised learning can help us glean information from our data that would otherwise be hidden. I’ve put together a notebook that takes you through K-means clustering (with cluster count optimization) to identify how samples may fall into groups. You’ll also learn about Gaussian Mixture models, and how they can help us with anomaly detection.
You can’t train a good model if you don’t have the right evaluation metric, and you can’t explain your model if you don’t understand the metric you’re using. So, here’s a list of common metrics which are used for ML and NLP models, along with their definitions and common applications. I’ve always had a difficult time remembering these from charts and confusion matrices, so I thought a verbal explanation might work better.
Accuracy Denotes the fraction of times the model makes a correct prediction as compared to the total predictions it makes. Best used when the output variable is categorical or discrete. For example, how often a sentiment classification algorithm is correct.
Precision Evaluates the percent of true positives identified given all positive cases. Particularly helpful when identifying positives are more important than overall accuracy. For example, if identifying a cancer that is prevalent 1% of the time, a model that always spits out “negative” will be 99% accurate, but 0% precise.
Recall The percent of true positives versus combined true and false positives. In the example with a rare cancer that is prevalent 1% of the time, if a model creates totally random predictions (50/50), it will have 50% accuracy (50/100), 50% precision (0.5/1), and 1% recall (0.5/50)
F1 Score Combines precision and recall to give a single metric — both completeness and exactness. (2 * Precision * Recall) / (Precision + Recall). Used together with accuracy, and useful in sequence-labeling tasks, such as entity extraction, and retrieval-based question answering.
AUC Area Under Curve; Combines true positives vs false positives as threshold for prediction is varied. Used to measure the quality of a model independent of prediction threshold, and to find the optimal prediction threshold for a classification task.
MRR Mean Reciprocal Rank. Evaluate the responses retrieved given their probability of being correct. The mean of the reciprocal of the ranks of the retrieved results. Used heavily in all information-retrieval tasks, including article search and e-commerce search.
MAP Mean average precision, calculated across each retrieved result. Used in information-retrieval tasks.
RMSE Root mean squared error — very common way to capture a model’s performance in a real-value prediction task. Good way to ask “How far off from the answer am I?” Calculates the square root of the mean of the squared errors for each data point. Used in numerical prediction — temperature, stock market price, position in euclidean space…
MAPE Mean absolute percentage error. Used when the output variable is a continuous variable, and is the average of absolute percentage error for each data point. Often used in conjunction with RMSE and to test the performance of regression models.
BLEU The cheese that tastes like it sounds. Also, bilingual evaluation understudy. Captures the amount of n-gram overlap between the output sentence and the reference ground truth sentence. Has many variants, and mainly used in machine translation tasks. Has also been adapted to text to text tasks such as paraphrase generation and summarization.
METEOR Precision-based metric to measure quality of generated text. Sort of a more robust BLEU. Allows synonyms and stemmed words to be matched with the reference word. Mainly used in machine translation.
ROUGE Like BLEU and METEOR, compares quality of generated to reference text. Measures recall. Mainly used for summarization tasks where it’s important to evaluate how many words a model can recall (recall = % of true positives versus both true and false positives).
Perplexity Measures how confused an NLP model is, derived from cross-entropy in a next word prediction task. Used to evaluate language models, and in language-generation tasks, such as dialog generation.
Of course you can find plenty more, but that’s a fairly good list when we’re talking NLP. Thanks for reading, and follow me on twitter — @SaladZombie
What’s bad? A badly chosen ML algorithm. What’s better? A well-chosen ML algorithm. What’s even better? A whole bunch of algorithms working together to get an optimal result from a bunch of different predictions.
In this full-code tutorial, you’ll learn about bagging, boosting, and how random forests pull together decisions from multiple decision trees to give you a result.
I’ve created a tutorial to take you through an SVM classifier using a nonlinear dataset – one we can’t just separate with a straight line. Here, we’re also introduced to GridSearch, a super helpful machine learning tool where we can automatically run through lots of hyperparameters to find the best ones for our model and dataset. Check it out!
I’ve written a tutorial on simple multiclass classification using the Iris dataset, with examples on how to use logistic regression, how a decision boundary works, and how Softmax regression is used to select the best of multiple categories in a classifier.
our algorithm doesn’t account for greediness on shoddy wooden rafts
I’ve created step-by-step tutorial which will help explain how scikit-learn can be used to build a data pre-processing pipeline. Furthermore, it shows how to load kaggle data, do some machine learning, and make an output. Check it out! everything works in Colab, my new BFF.